Loading...
Specification Guide
How OGraf works — explained simply.
Whether you're a designer, developer, or broadcaster, this guide explains the OGraf format in plain language with real examples. No prior experience needed. For the full technical specification, see the official EBU documentation.
The big picture
Imagine you design a lower third in After Effects. Today, you'd export it differently for every system — one version for CasparCG, another for SPX, another for Vizrt. Each with its own format, quirks, and limitations.
OGraf eliminates that. You build your graphic once as a small web page (HTML + CSS + JavaScript), wrap it in a standard package, and it plays on any OGraf-compatible system. Same file, everywhere.
You create
Design the graphic using HTML, CSS, and JavaScript — the same tools used to build websites.
You package
Add a manifest file that describes your graphic — its name, data fields, and behavior.
It plays
Any OGraf-compatible playout system (SPX, CasparCG, ograf-server…) can load and run it.
The three roles in the OGraf ecosystem
Think of it this way
Think of OGraf like a PDF. A PDF looks the same whether you open it in Adobe Reader, Chrome, or Preview. An OGraf graphic works the same whether it runs on SPX, CasparCG, or any other compatible system. The format is the contract.
The OGraf workflow
How an OGraf graphic flows on-air
From the designer's text editor to a frame of live broadcast, here's every stage in the OGraf workflow — and where each part of the ecosystem plugs in.
What's inside a package
An OGraf package is just a folder with a few files. No special software needed to create one — you can build it with any text editor.
my-lower-third/
my-lower-third.ograf.json← The manifest (required)
graphic.mjs← Your graphic code
style.css← Your styles
thumbnail.png← Preview image
assets/
brand-font.woff2← Custom font
logo.svg← Logo or images
A typical OGraf package for a lower third
Two files are required: the manifest (.ograf.json) and the JavaScript module its main field points to. Everything else is up to you — bundle any fonts, images, CSS or JavaScript libraries the graphic needs inside the package.
For After Effects designers
If you use tools like Ferryman or Loopic, they generate this package for you automatically. You design visually, and the tool exports an OGraf-ready folder. No coding required.
The manifest file
The manifest is a small JSON file that describes your graphic to the world. It answers questions like: What's this graphic called? What data does it need? How does it behave?
When someone loads your graphic in SPX or any other controller, the controller reads this file first. It uses the information to show the graphic's name in the template list, generate data entry forms for the operator, and know how to control playback.
my-lower-third.ograf.jsonJSON
{
  "$schema": "https://ograf.ebu.io/v1/specification/json-schemas/graphics/schema.json",

  "id": "com.mystation.lower-third",
  "version": "1.0.0",
  "name": "News Lower Third",
  "description": "Standard two-line name and title overlay",

  "author": {
    "name": "Jane Smith",
    "email": "jane@mystation.com"
  },

  "main": "graphic.mjs",

  "stepCount": 1,
  "supportsRealTime": true,
  "supportsNonRealTime": false,

  "schema": {
    "type": "object",
    "properties": {
      "name":  { "type": "string", "title": "Name",  "default": "John Doe" },
      "title": { "type": "string", "title": "Title", "default": "Reporter" }
    }
  }
}
Let's break down each part:
Think of it this way
The manifest is like the back of a board game box. It tells you the game's name, how many players it supports, what's included, and the basic rules — before you even open it. Controllers read the manifest to know how to present and operate your graphic.
How a graphic comes to life
When an operator clicks "Play" in their controller (like SPX), a precise sequence happens behind the scenes: the renderer calls these methods on the graphic, in this order. Understanding this sequence is key to understanding OGraf. Graphics can also declare custom actions — a goal flash on a scoreboard, say — which controllers show as extra buttons and deliver through customAction().
1
load()
The graphic receives the operator's data (name, title, colors…) and gets ready.
Operator fills in "Jane Smith" and "Reporter" in the form.
2
playAction()
The graphic animates onto screen. The lower third slides in from the left.
Director clicks Play. The name super smoothly animates in.
3
updateAction()
Data changes while the graphic is on-air. The text updates live.
Title changes from "Reporter" to "Senior Correspondent" mid-show.
4
stopAction()
The graphic animates off screen. The lower third slides back out.
Director clicks Stop. The graphic animates out cleanly.
5
dispose()
Everything is cleaned up. Memory released. Ready for the next graphic.
System clears the graphic from the renderer's memory.
The lifecycle of an OGraf graphic during a live broadcast
Each of these steps is a method in your code. The renderer calls them in order, and waits for each to finish before calling the next. This means: when you tell the renderer "my animation takes 500ms," it respects that and doesn't interrupt.
The key insight
OGraf doesn't care how you animate your graphic — CSS transitions, JavaScript, GSAP, Lottie, canvas, SVG — anything works. It only cares when you're done. Signal "I'm ready" and the renderer moves on.
Steps — for multi-page graphics
Not every graphic is a simple lower third. Election results might have 5 pages. A sports scoreboard might update dynamically. OGraf handles this with steps.
stepCount: 0Fire-and-forget
Played once, it runs from start to end on its own — in, hold, out. There are no steps for the operator to advance.
Examples: Replay sting, transition wipe, bumper animation
▶️ In✨ Auto⏹️ Out
stepCount: 1Single step (most common)
Appears when played, stays visible, disappears when stopped.
Examples: Lower third, bug, logo watermark, clock
▶️ In⏸️ Hold⏹️ Out
stepCount: 3Multi-step
Each Play advances to the next page. Stop exits from any page.
Examples: Election results (3 parties), multi-stat graphic, slideshow
▶️ Page 1▶️ Page 2▶️ Page 3⏹️ Out
stepCount: -1Dynamic steps
Number of pages depends on the data — could be 2 or 20.
Examples: Data-driven tables, live leaderboards, scrolling lists
▶️ Page 1▶️ ...▶️ Page N⏹️ Out
Data and forms
The most powerful part of OGraf for designers: you define what data your graphic needs, and the controller automatically builds a form for the operator. No custom UI required.
This is done through the schema in your manifest, using a format called GDD (Graphics Data Definition). Don't let the name intimidate you — it's just a way to say "this graphic needs a text field called Name and a color picker called Background."
What the operator sees
Breaking News
#2563eb
Left ▾
500 ms
What you write in the manifest
"schema": {
"properties": {
"headline": {
"type": "string",
"gddType": "single-line",
"default": "Breaking News"
},
"bgColor": {
"type": "string",
"gddType": "color-rrggbb",
"default": "#2563eb"
},
"position": {
"type": "string",
"gddType": "select",
"enum": ["left","center","right"]
},
"duration": {
"type": "integer",
"gddType": "duration-ms",
"default": 500
}
}
}
What the operator sees vs. what you write in the manifest
Available field types
The gddType tells the controller what kind of input to show. Here are the options:
single-lineText input (one line)
multi-lineText area (multiple lines)
selectDropdown menu with choices
color-rrggbbColor picker
color-rrggbbaaColor picker with transparency
file-pathFile browser
file-path/image-pathImage file browser
percentagePercentage slider
duration-msDuration in milliseconds
Every concept in this spec maps to something real you can build. Each tutorial walks you through one complete OGraf graphic — manifest, Web Component, animation, data — in 10 to 25 minutes.
Real-world examples
Pick one and build it. Every example ships as a working OGraf package.

Beginner15 min
Lower Third
Name & title overlay

Beginner10 min
Bug / LIVE
Corner indicator with pulse

Intermediate20 min
News Ticker
Scrolling headline crawl
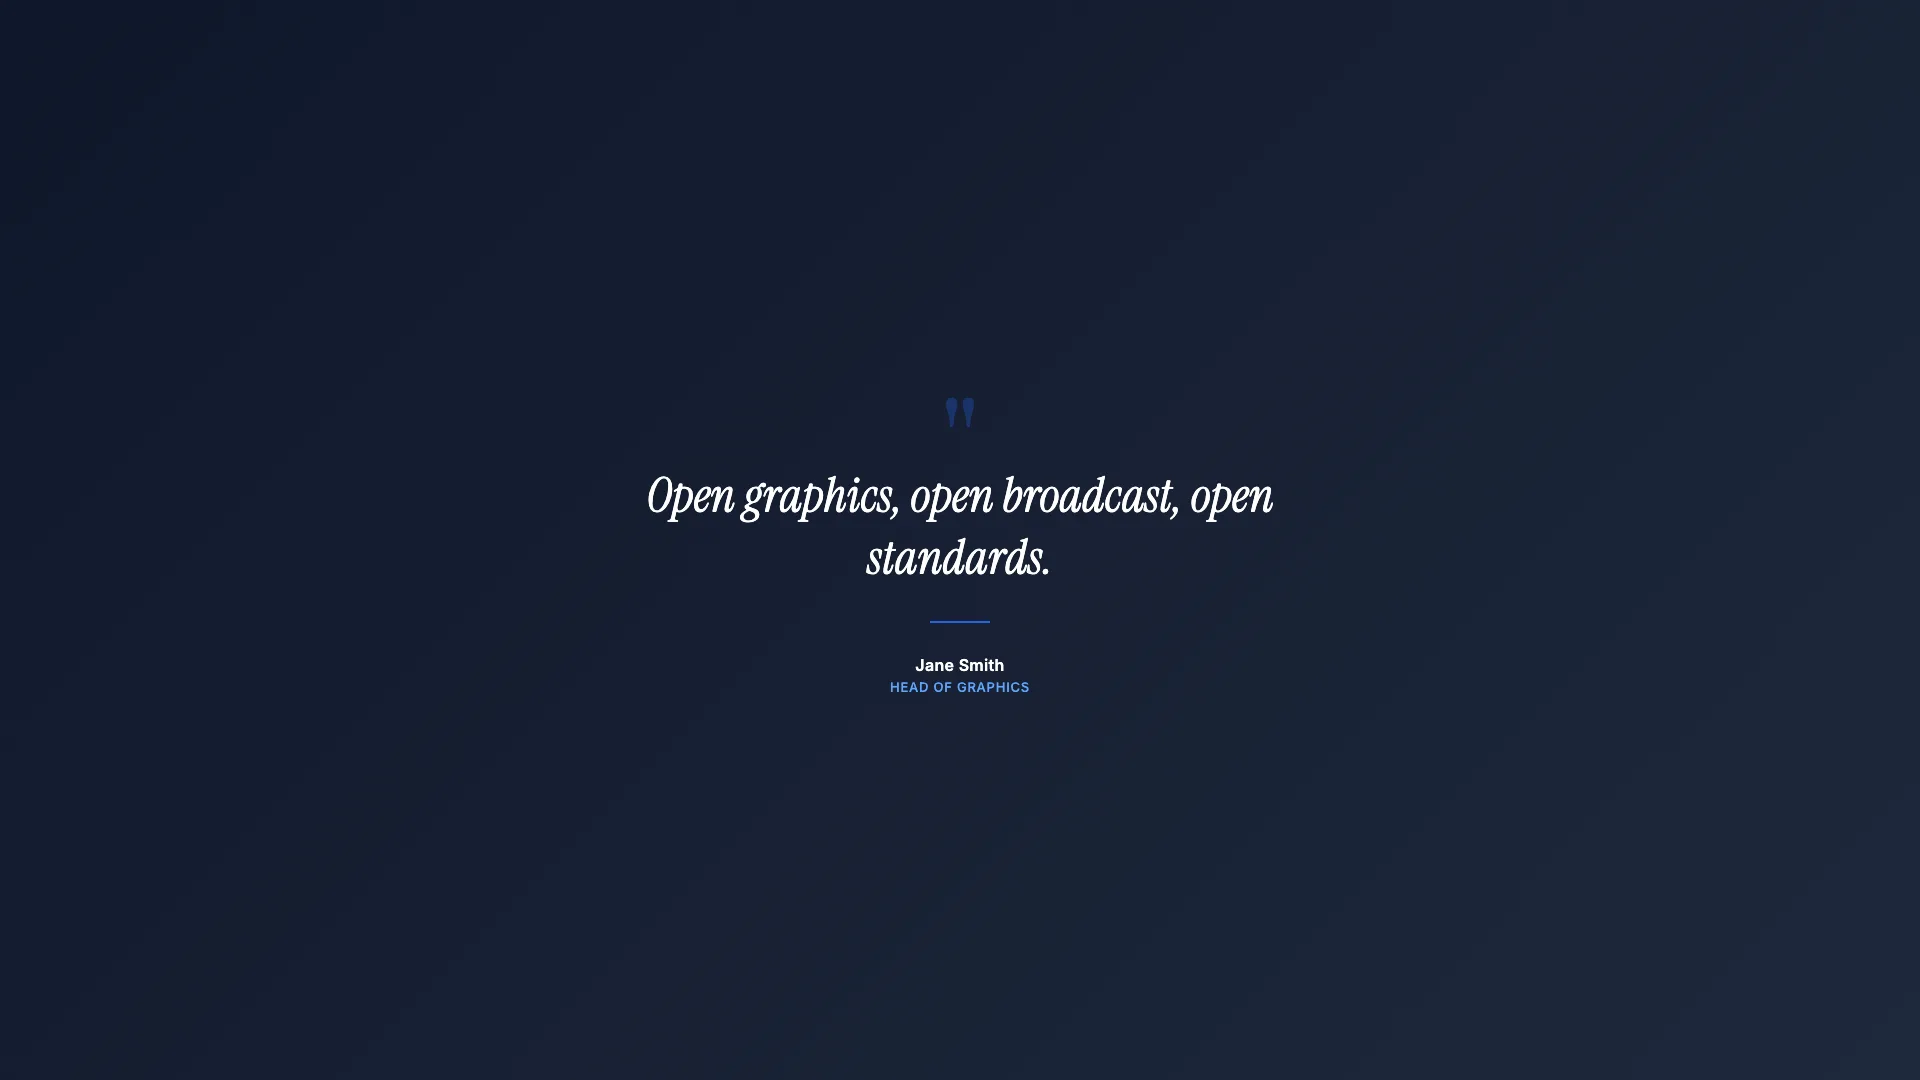
Intermediate15 min
Full Page Quote
Cinematic full-screen typography
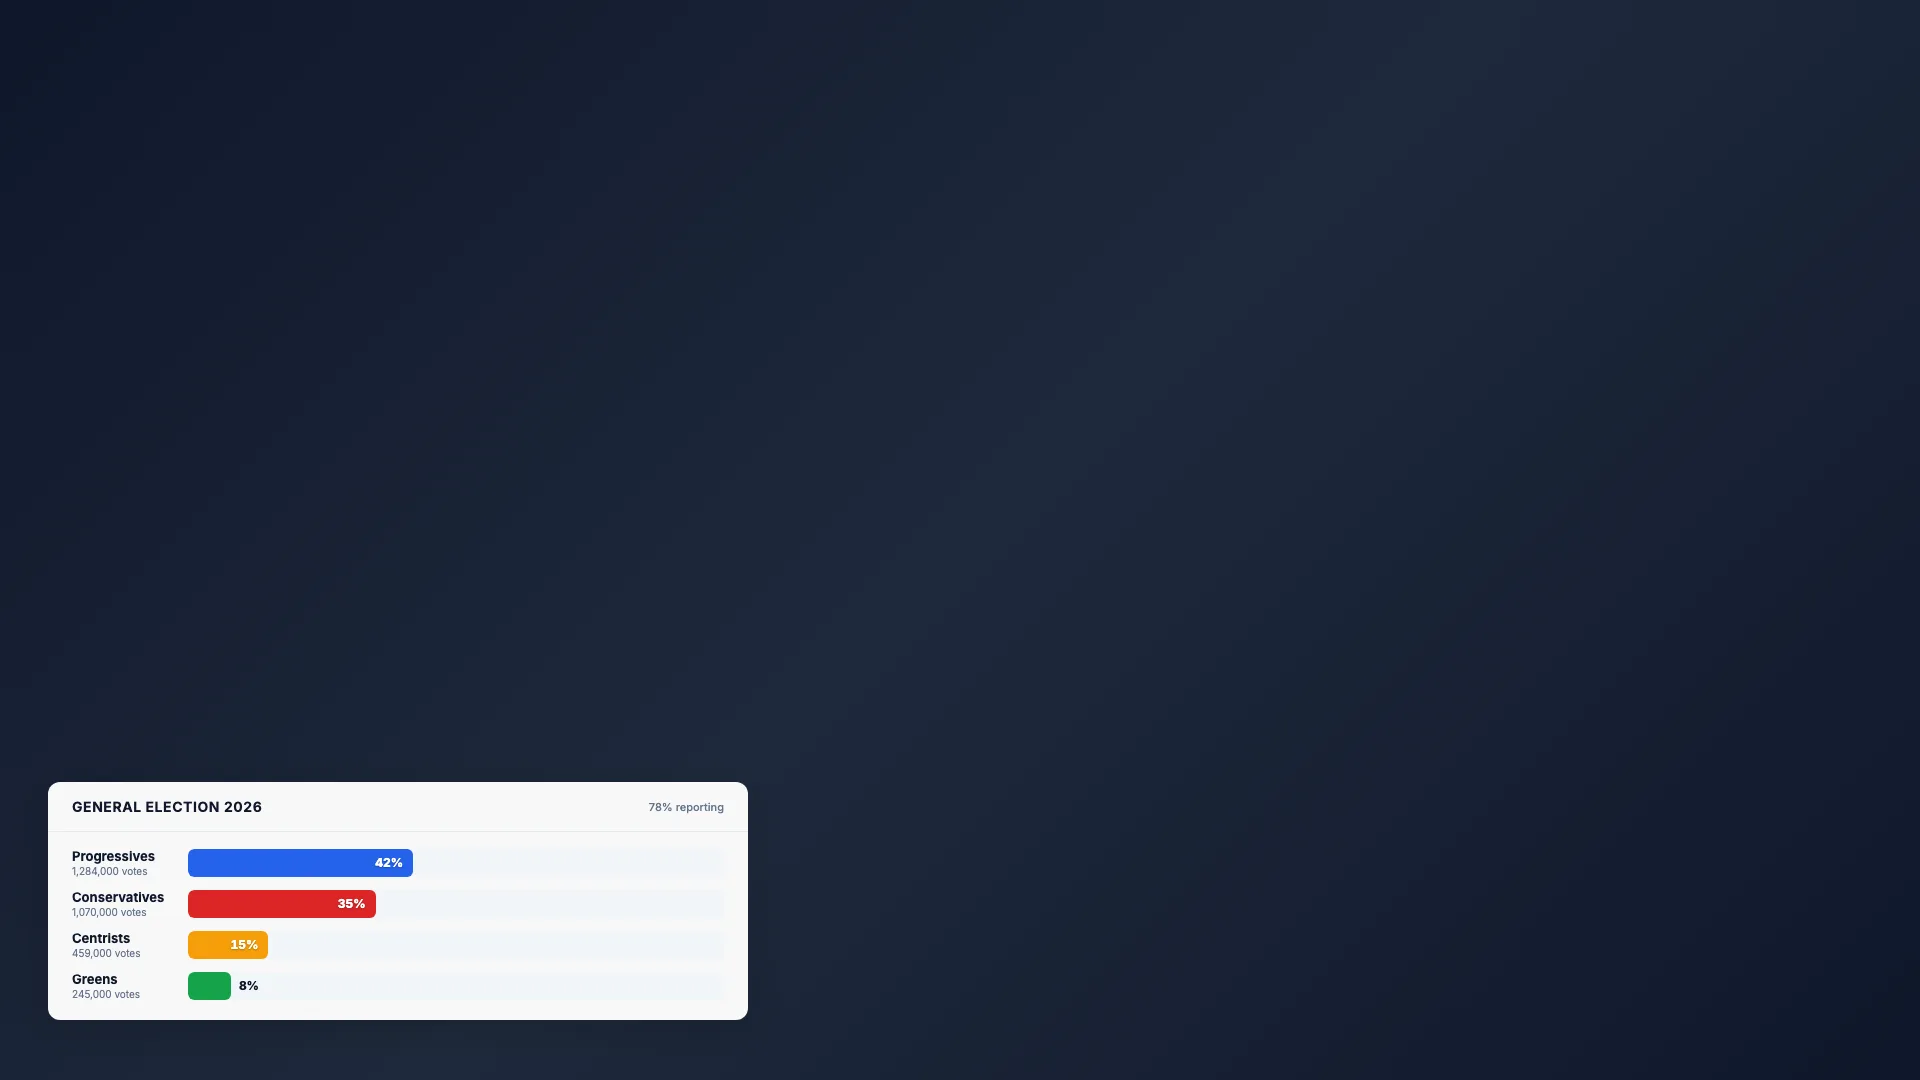
Intermediate20 min
Election Bars
Animated percentage chart
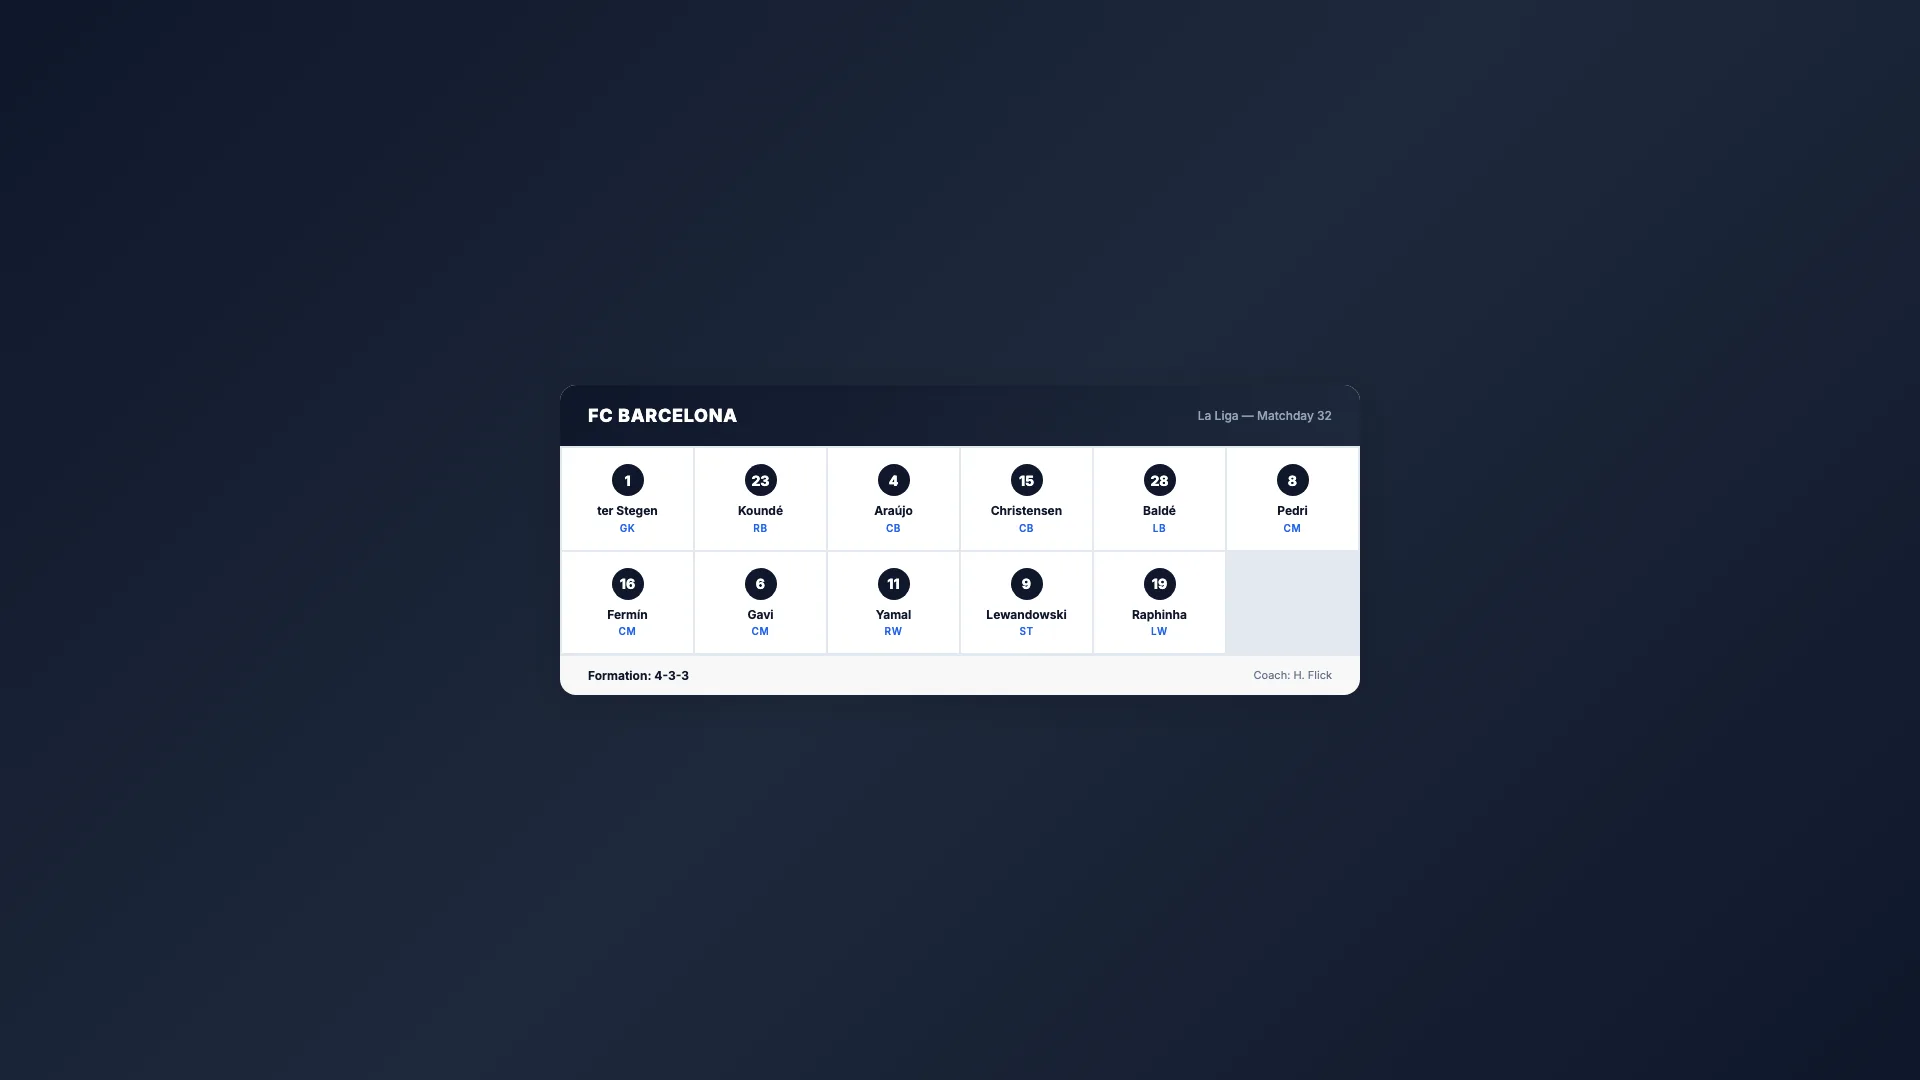
Intermediate20 min
Sport Lineup
Team roster grid

Advanced25 min
Score Bug
Live match scoreboard
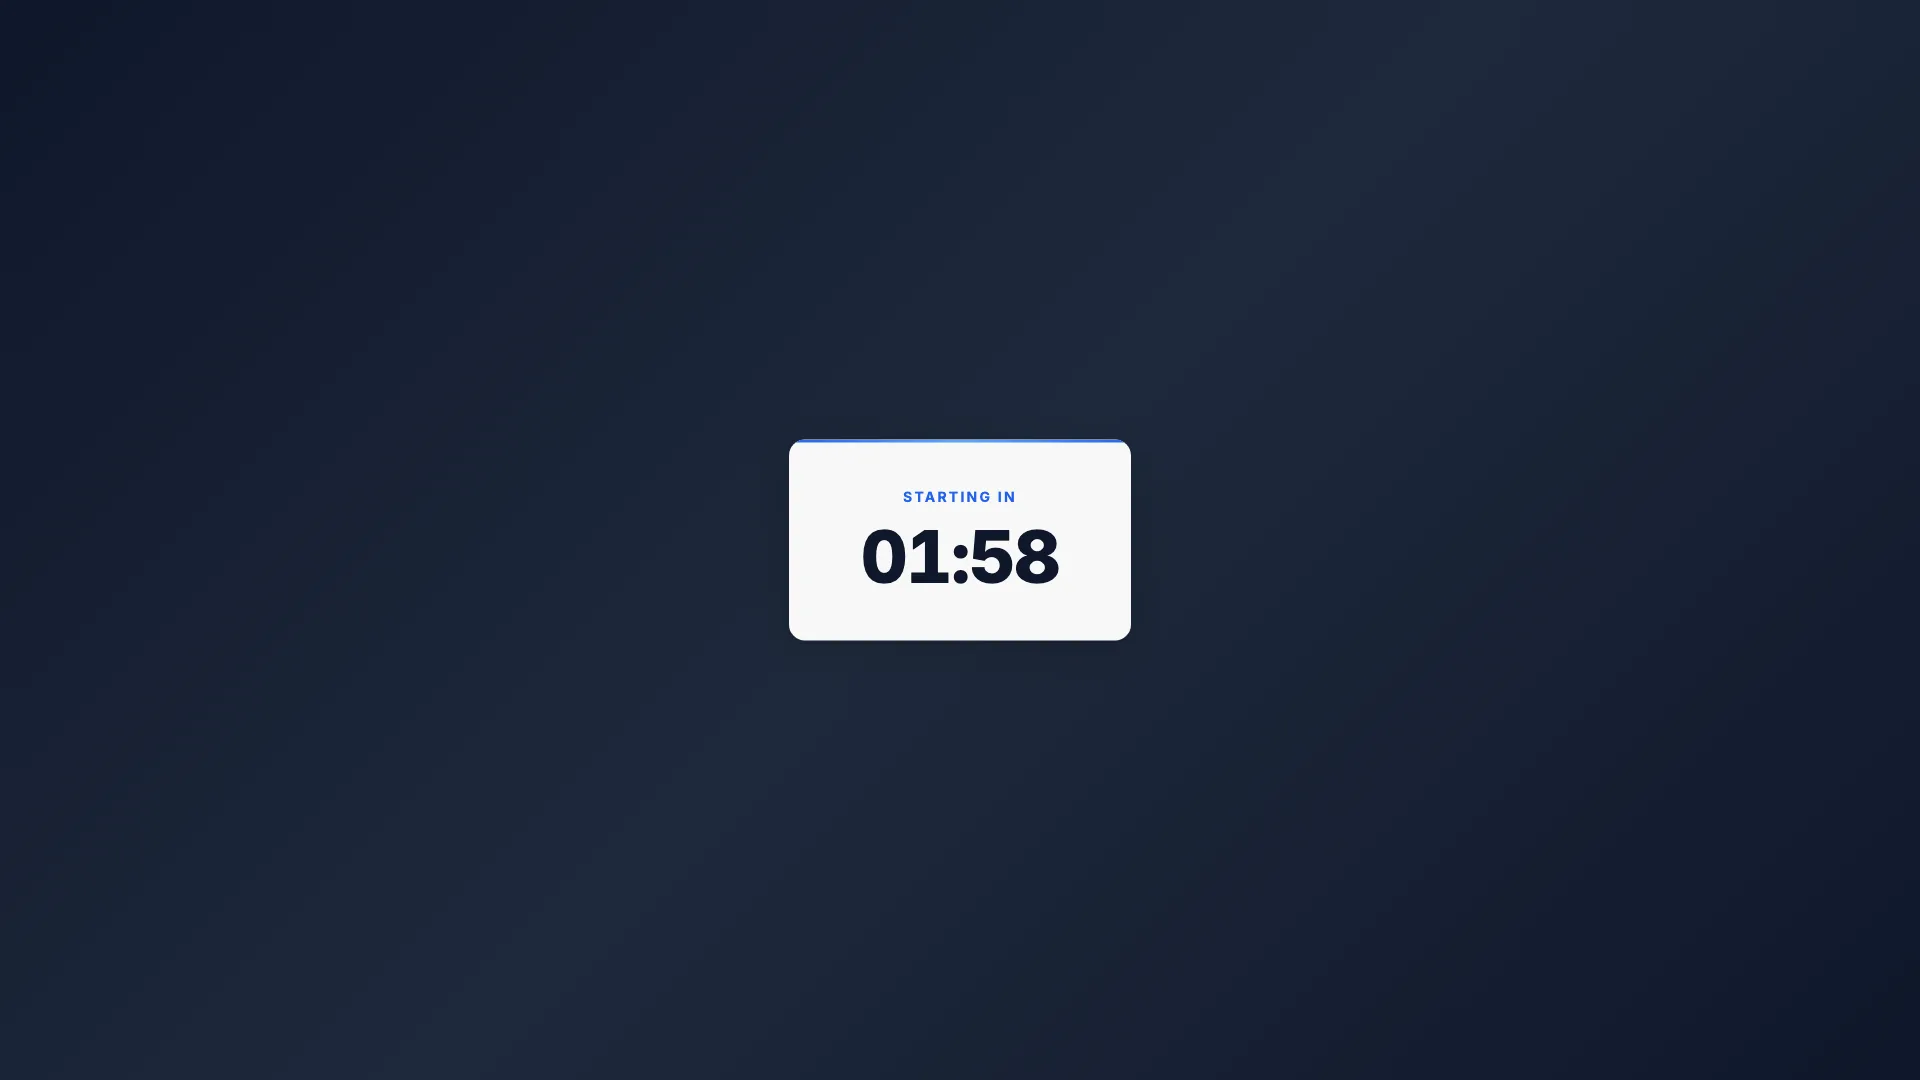
Intermediate15 min
Countdown Timer
Self-ticking clock

Intermediate15 min
Breaking News
Full-screen urgent alert
Intermediate20 min
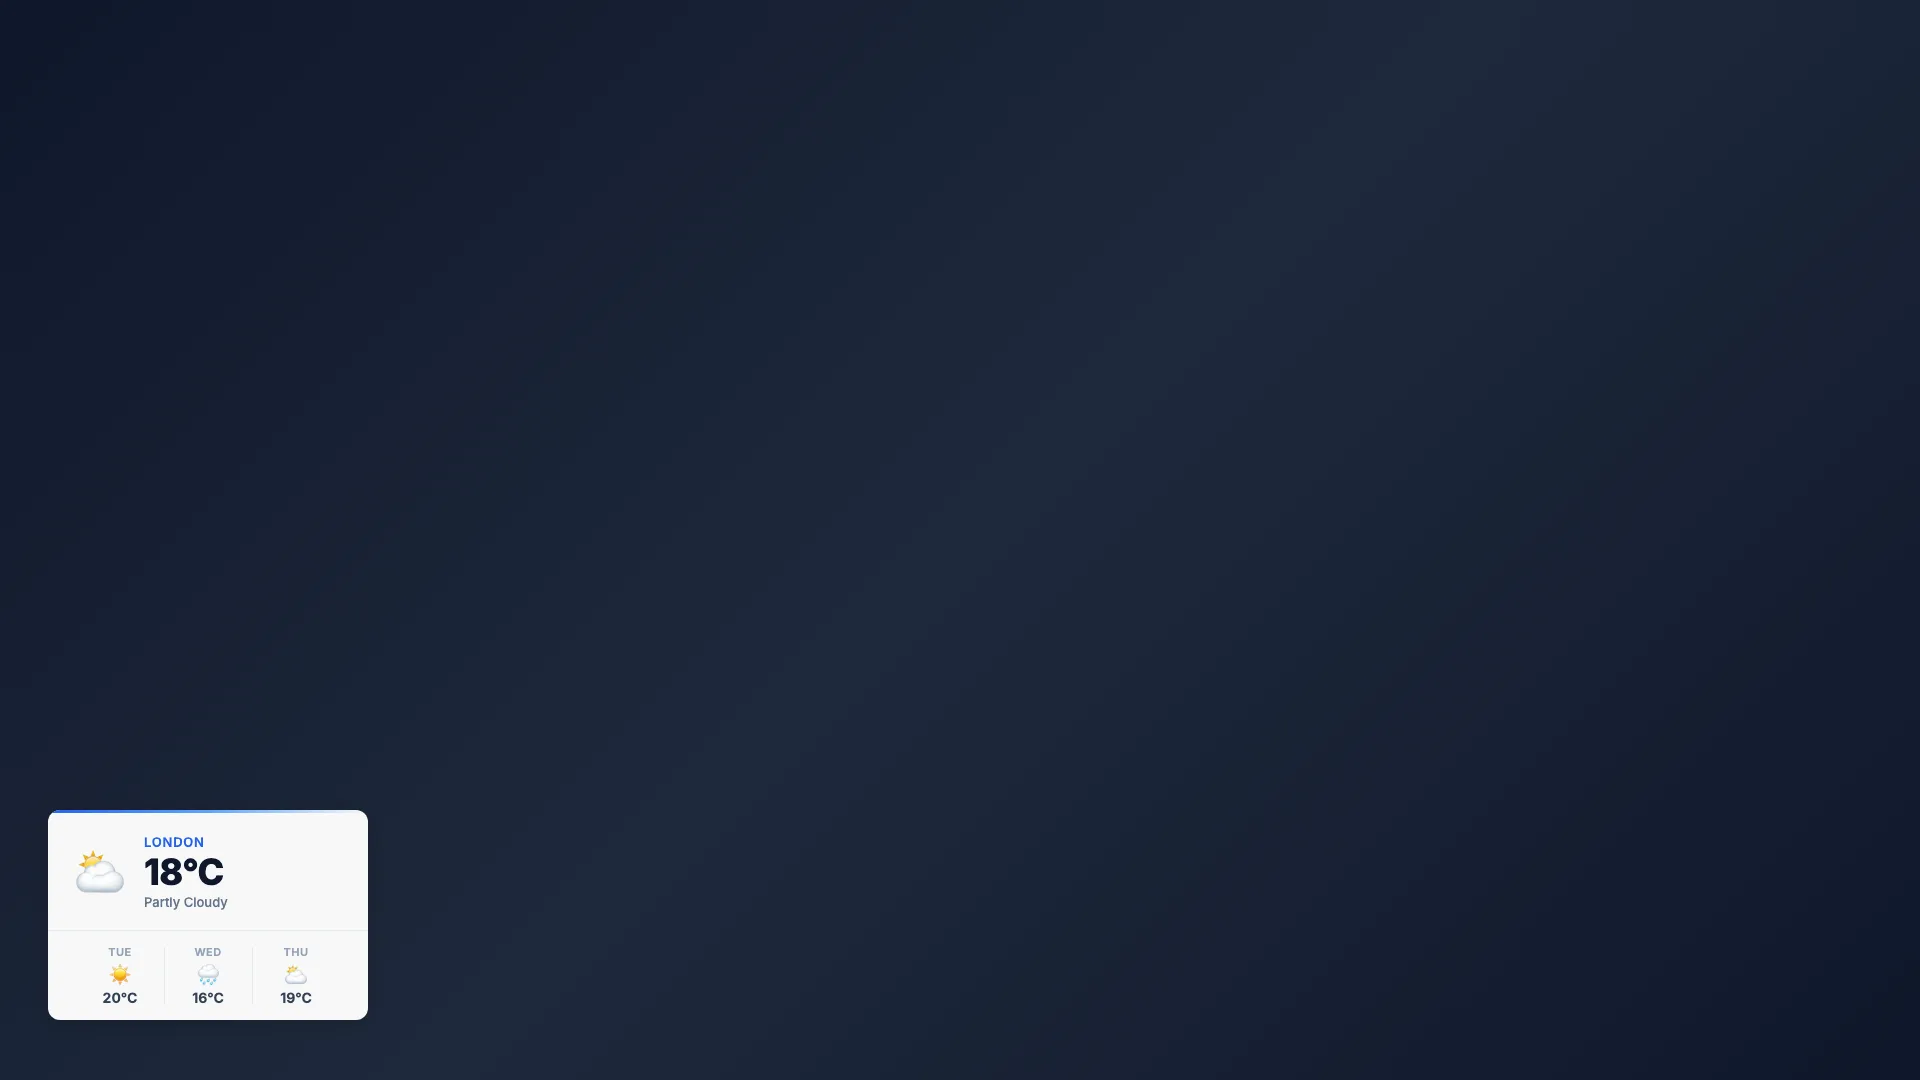
Weather Forecast
Conditions & 3-day outlook

Beginner10 min
Social Media Card
Post overlay with avatar
Advanced topics
These features are less common but important for specialized workflows.
Next steps
Build your first template
Hands-on tutorial. Zero to a working lower third in 15 minutes.
Start building →
Official EBU specification
The full technical specification with JSON schemas and TypeScript types.
Read the spec →
Explore the ecosystem
Discover editors, renderers, controllers, and tools that support OGraf.
See all tools →
Check your package
Drop a .zip and get a structured report against 85 rules and the live EBU schema.
Open the checker →